What happens to our heart rate when we listen to plants?
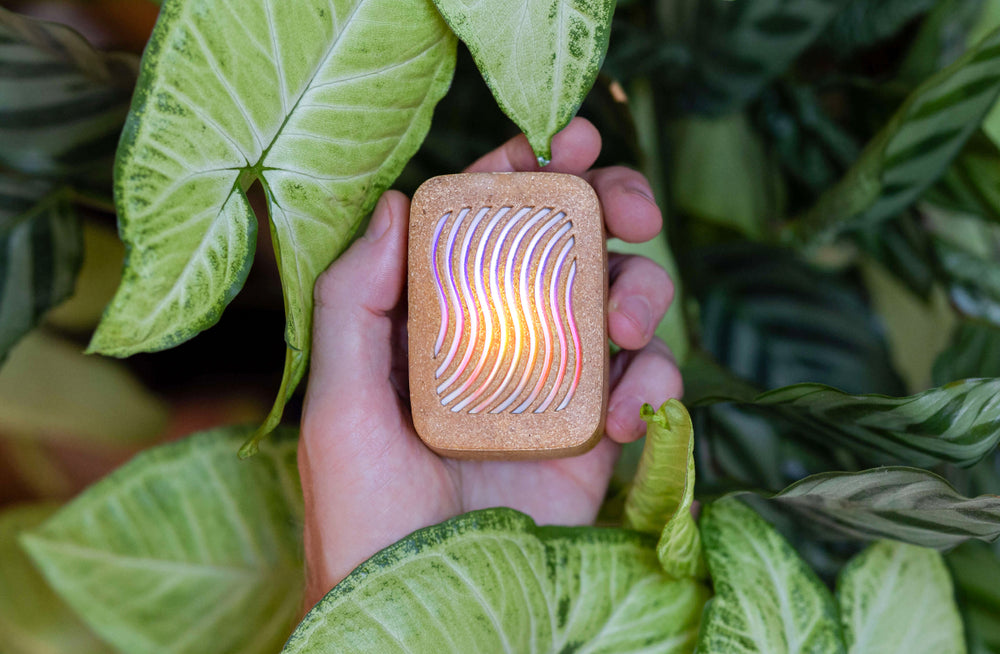
At Design Healdsburg this October, Lisa Staprans of Staprans Design created the NeuroBeauty Sensory Room: a quiet space with a bamboo wall, a glass moon, and four living plants making music through PlantWave.
We wanted to learn what was happening in people’s bodies during the experience. Over four days, PlantWave Labs invited guests to wear a sensing headband that recorded heart rate and brain activity. We measured them first in a quiet waiting room, then during three minutes of listening to the plants.
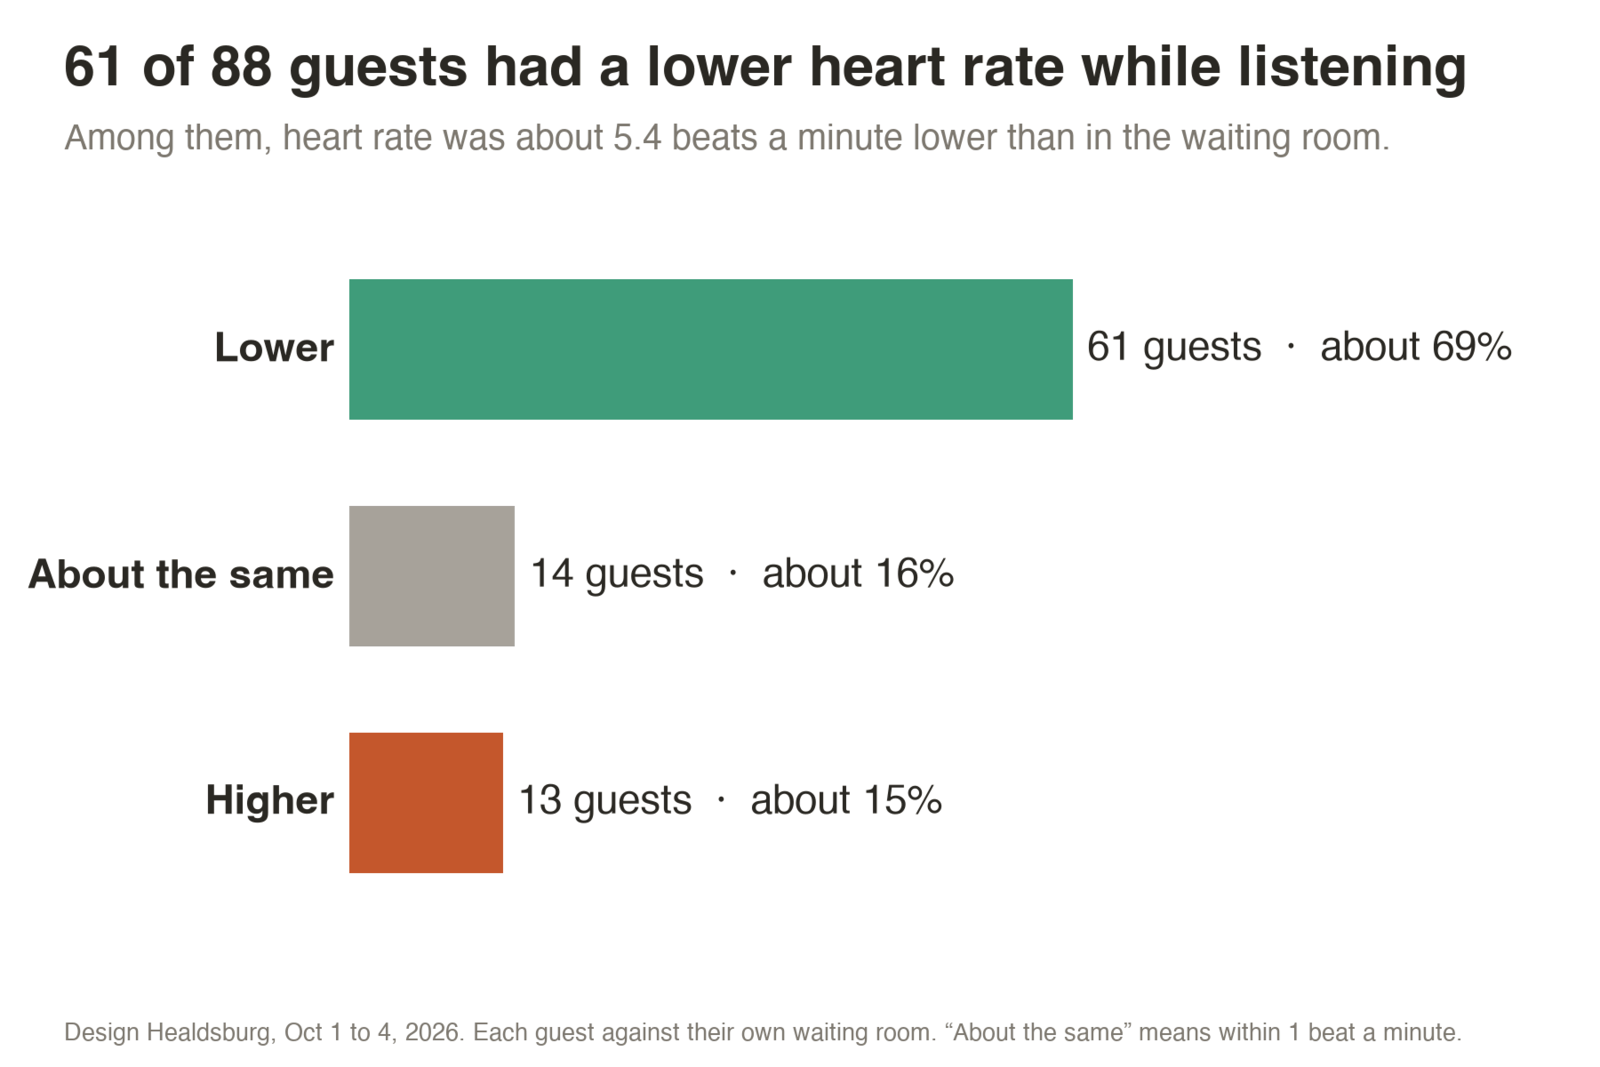
Across all 88 guests with usable heart-rate recordings, heart rate averaged about 3.3 beats per minute lower during the listening session than in the waiting room. For 61 of those guests (69%), heart rate was lower. Among those 61, the average decrease was 5.4 beats per minute.
These are comparisons within each person, not comparisons between different groups of people. The results tell us what happened during the experience, though not which part of the experience caused it.
The Room
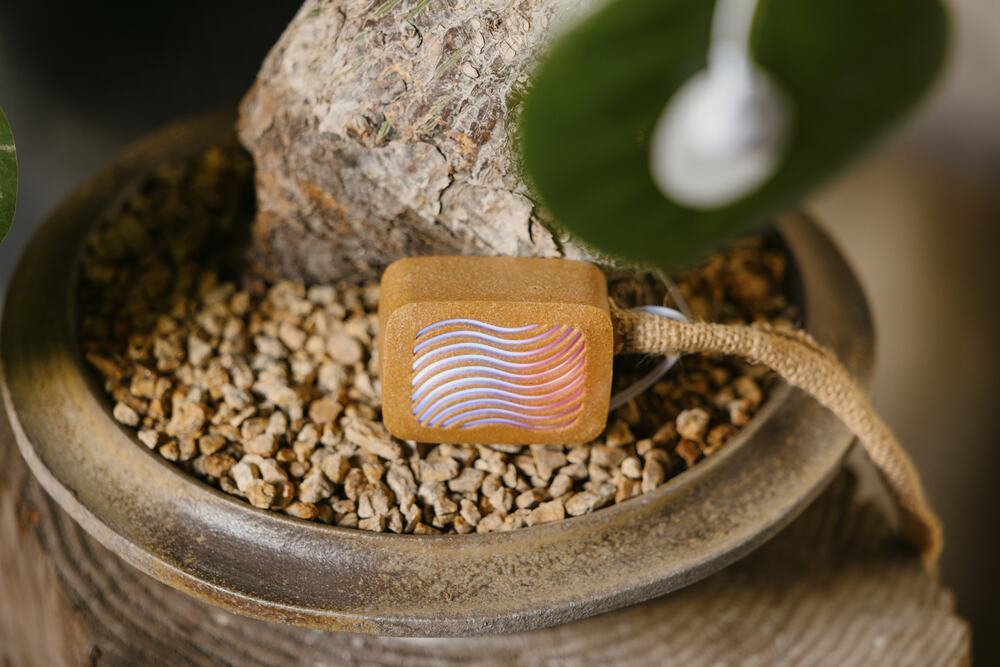
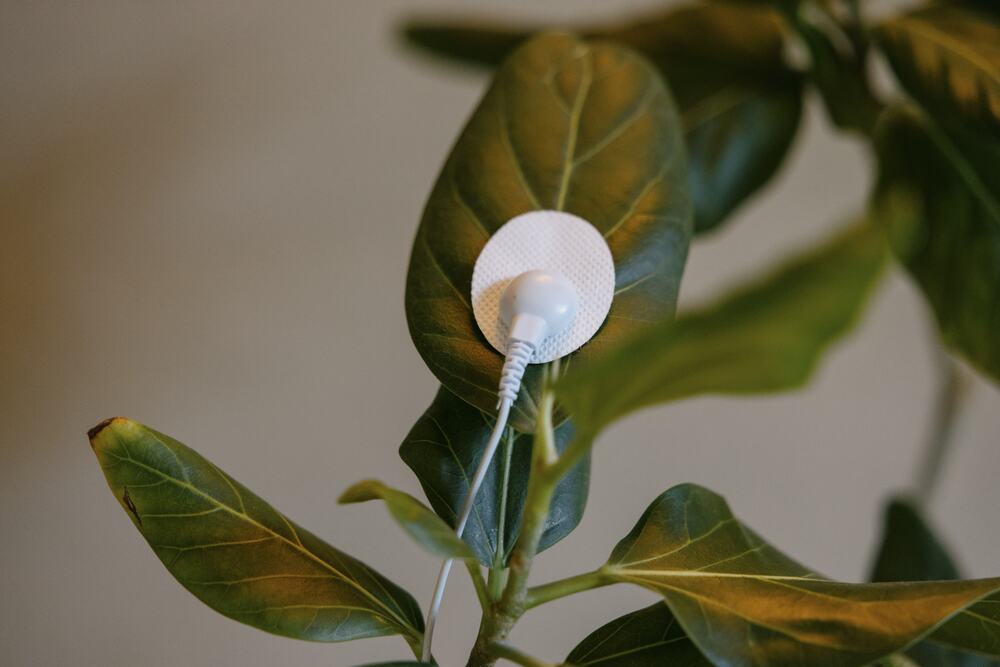
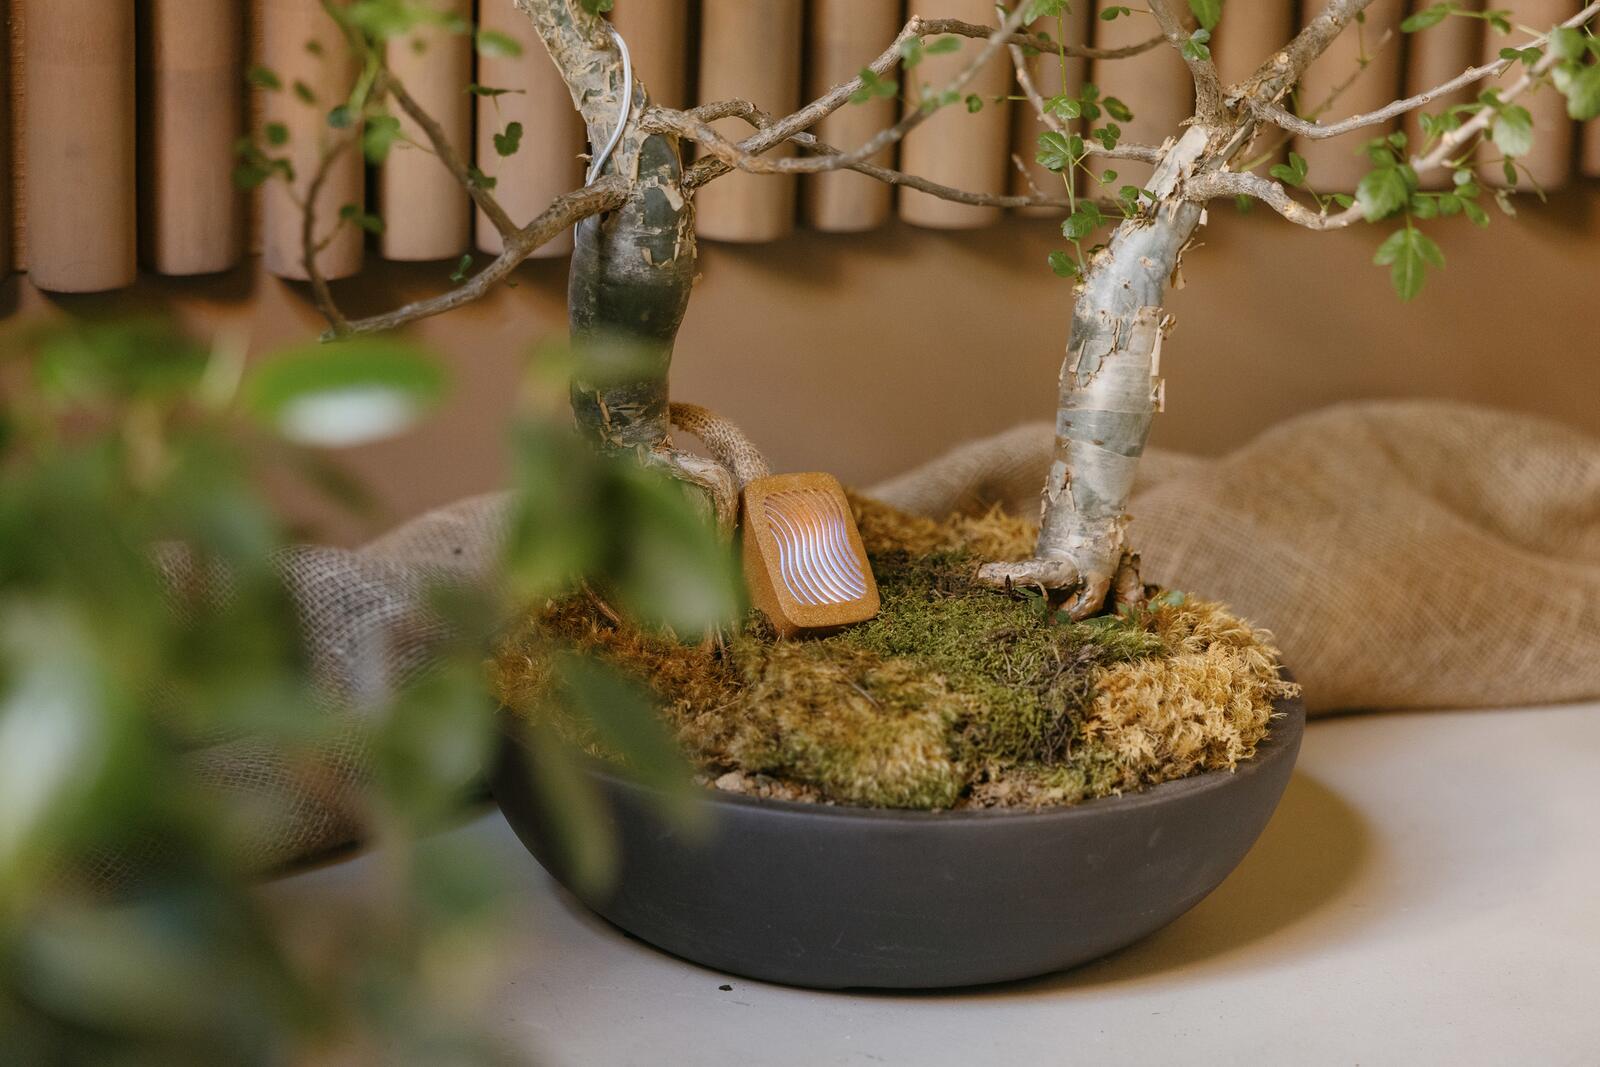
Design Healdsburg ran October 1–4, 2026. Guests passed through two rooms filled with trees before arriving at the NeuroBeauty Sensory Room. Inside, four plants were connected to PlantWave. The devices measured changes in the plants’ electrical activity and used those signals to generate music in real time. Guests could sit, look around, and listen.
Taking part was optional. Each guest's data was stored under a random ID with no name attached.
How We Measured
Each participating guest followed the same sequence:
- Waiting room. Two quiet minutes without music, used as the starting measurement for each guest.
- Walking. A short walk to a chair in the NeuroBeauty Sensory Room.
- Settling in. A bell sounded, followed by 30 seconds to get comfortable while the plants played.
- Listening. Three minutes in the room with the plant music, ending with a second bell.
The headband recorded heart rate and brain activity throughout. We excluded the walk and the first 30 seconds after sitting down, when movement could disrupt the recording. We then compared each guest’s heart rate during listening with their heart rate in the waiting room.
We included heart-rate data only when the recording was usable in both rooms. If movement or headband contact made too many readings unreliable, we excluded that guest from the individual analysis. That left 88 usable heart-rate recordings. Guests without usable recordings received the group findings rather than an individual result.
Guests were asked to keep their eyes open since the room is also meant to be seen.

One important limitation: the waiting room and listening room were different environments. The light, seating, visual surroundings, and movement between rooms all changed. We cannot separate their effects from the effects of the plant music in this comparison.
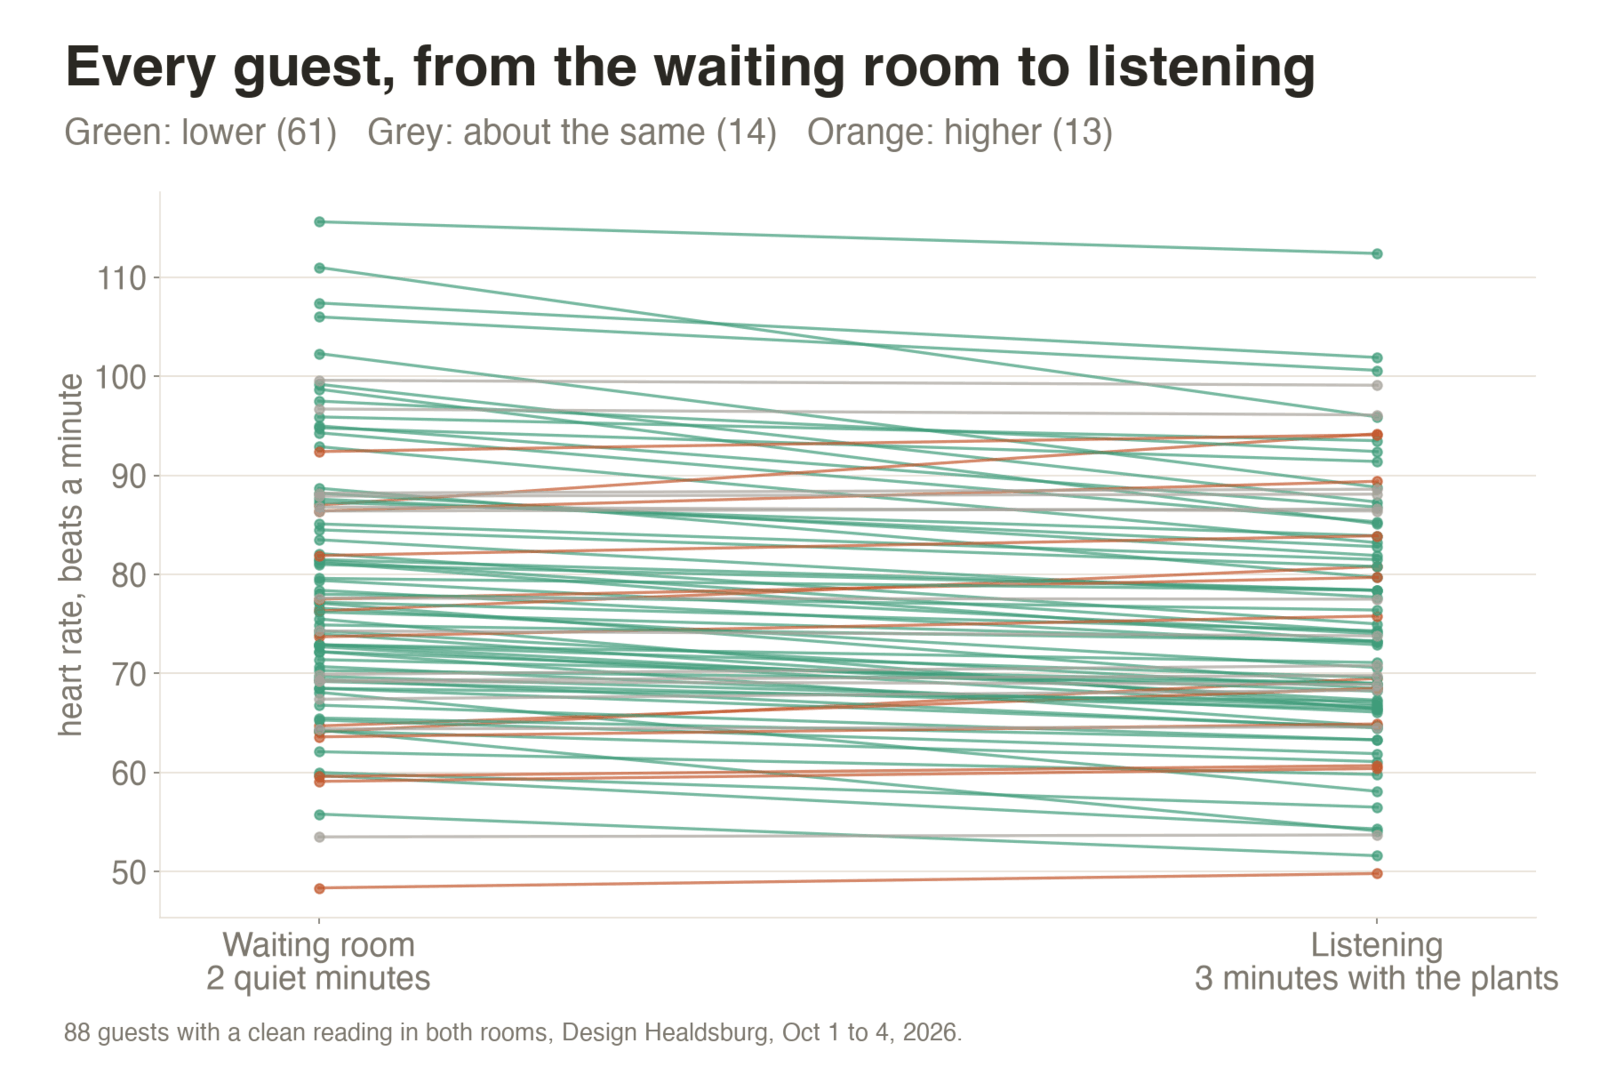
How Heart Rate Changed Over Three Minutes
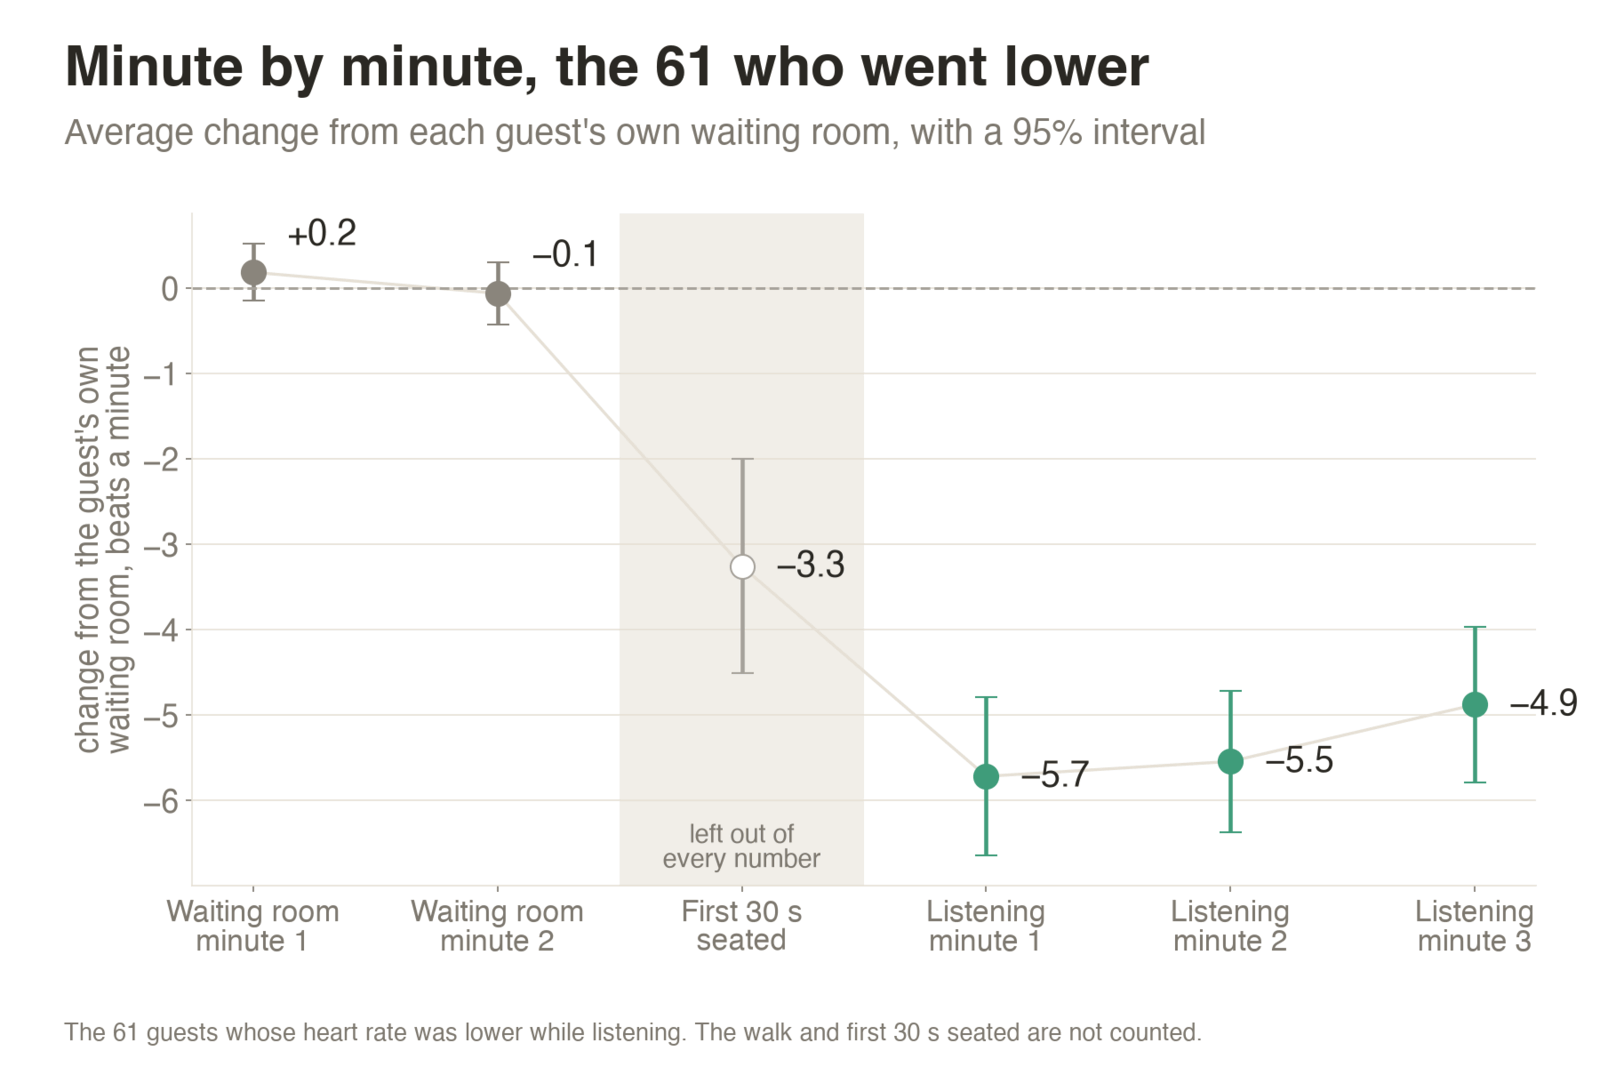
Looking at all 88 guests, average heart rate was 3.5 beats per minute lower than each person's waiting-room baseline in both the first and second minutes of listening, and 3.3 beats per minute lower in the third. The chart shows the group average at each minute with 95% intervals. The walk and first 30 seconds after sitting down were excluded from the listening comparison.

For the 61 guests whose heart rate was lower overall during listening, the average difference was larger: 5.7 beats per minute lower in the first minute, 5.5 in the second, and 4.9 in the third. The following chart shows this subgroup, not the full group.
Checking the First Two Minutes
Some guests moved before the final bell, which could affect the recording. To check whether the last minute was influencing the results, we repeated the comparison using only the first two minutes of listening, matching the length of the waiting-room baseline. The proportion of guests with a lower heart rate was nearly identical.
| Three minutes of listening | First two minutes | |
|---|---|---|
| Guests with a clean reading | 88 | 87 |
| Lower | 61, about 69% | 60, about 69% |
| About the same | 14 | 14 |
| Higher | 13 | 13 |
| Average drop among those lower | 5.4 beats a minute | 5.7 beats a minute |
We use the full three-minute listening period as our primary result because that was the measurement window we planned before the event.
What the Other Measurements Showed
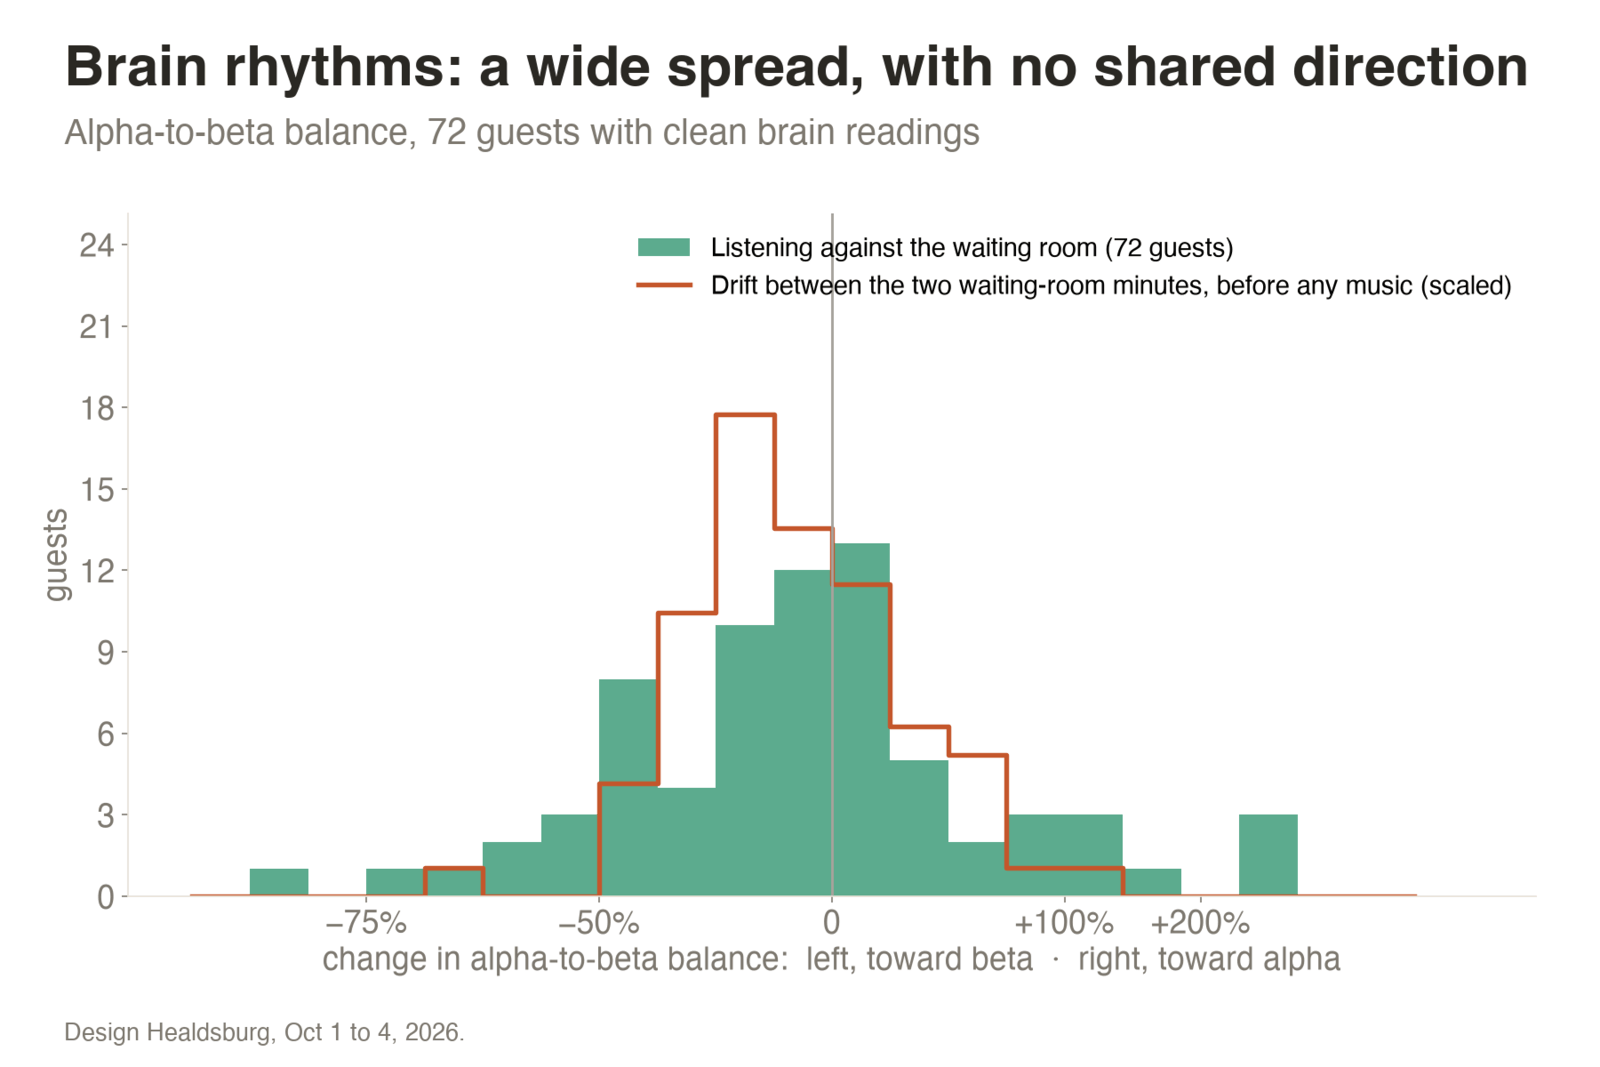
We also examined alpha and beta brain rhythms in 72 usable recordings. Twenty-six guests shifted toward alpha, 39 toward beta, and seven changed by less than 5%. There was no consistent direction across participants, so these EEG results are inconclusive.
Guests kept their eyes open because the room was designed to be seen as well as heard. Eyes-open conditions can influence alpha activity, but we cannot tell whether that accounts for the mixed findings.
We also explored breathing rate. The headband estimates breathing from subtle variations in the pulse, but the short recordings did not produce sufficiently reliable measurements for most guests. We are not reporting a breathing result.
What the Results Can—and Cannot—Tell Us
We observed a lower average heart rate during the listening experience than during the waiting-room baseline. But this was an exploratory installation, not a controlled clinical study. There was no comparison group sitting in the same room without plant music, or listening to conventional ambient music. Everyone moved through the experience in the same order.
Because the environments and activities changed together, we cannot conclude that PlantWave itself caused the lower heart rate. Nor do these findings establish a medical benefit or treatment effect.
They do give us a useful direction for future research: comparing plant-generated music with silence and other types of music under otherwise identical conditions.
Key Takeaways
- Across all 88 usable heart-rate recordings, average heart rate was approximately 3.3 beats per minute lower during listening.
- 61 of 88 guests (69%) had a lower heart rate during listening than in the waiting room.
- Among them, heart rate came down by about 5.4 beats a minute.
- Among those 61 guests, the decrease appeared in the first minute and continued through the third.
- Brain rhythms varied from guest to guest, with no shared direction.
- Without a matched control condition, the measurements cannot tell us what caused the change.
Frequently Asked Questions
Does listening to plants lower your heart rate?
At Design Healdsburg, 69% of guests with usable recordings had a lower heart rate while listening than in the waiting room, and the average across all 88 guests was approximately 3.3 beats per minute lower. Because the rooms and activities differed, we cannot attribute the change specifically to the plant music.
What did guests wear?
A sensing headband that records heart rate and brain activity. PlantWave Labs runs the measurement, and each recording is stored with no name attached.
Why do some guests not have a reading?
A heart reading counts only when it is clean in both rooms. When the headband shifted too much, that guest received the group results instead of a personal number.
Why were the brain results mixed?
We did not find a consistent shift toward alpha or beta. The short recordings and eyes-open conditions may have affected the results, but we cannot determine why individuals differed.
Where can I hear the plants?
The sound in the NeuroBeauty Sensory Room came from PlantWave, which turns a plant's electrical signals into music in real time.
PlantWave measures changes in electrical activity between points on a plant and translates them into real-time generative music. Learn more →
Measured at Design Healdsburg, October 1 to 4, 2026, in the NeuroBeauty Sensory Room by Staprans Design. Group numbers only. No guest is identified.