PlantWave turns a changing electrical measurement on a plant into changing musical output. The important idea is that the system is a measurement and mapping pipeline: an electrical reading from living systems — electrical activity in plants and fungi — becomes a time-varying signal (a "wave"), and that wave is mapped into musical parameters — especially pitch — that drive instrument collections called soundsets.
This article focuses on the mechanism: what is measured, how that measurement becomes a wave, how the wave becomes pitch, and how pitch becomes sound through selectable soundsets.
The Electrodes-to-Soundset Pipeline

PlantWave describes a straightforward sequence from sensing to sound: it detects slight electrical variations using two electrodes on leaves, graphs those variations as a wave, translates that wave into pitch messages that determine notes, and routes those notes to instruments grouped into soundsets.

Pitch is central to the mapping, but it's not the only musical dimension. PlantWave notes that other characteristics of the wave can also affect how instruments are played — including tempo and effects — so the system maps multiple features of the incoming signal, not just a single value.
What's Actually Being Measured: Conductivity

Electrical conductivity is a material property describing how readily electric current can flow through a material — technically, it's the reciprocal of resistivity. In practical terms: high conductivity means current flows more easily; low conductivity means it flows less easily.
PlantWave's own wording is specific: it measures microfluctuations in conductivity between two points on a plant. That means an electrical measurement taken across two contact points — the electrodes. When you place two electrodes on a conductive medium, you can measure how easily charge moves through the path between them. In watery, ion-containing materials like plant tissue, this charge transport is dominated by ionic conduction — the movement of ions in water, rather than free-electron conduction as in metals.
PlantWave adds a plain-language interpretation: the conductivity between those two points is "largely related to how much water there is between them," and it changes as plants photosynthesize and move chloroplasts around.
The key point for skeptics: the measurement is real and continuously varying. There is a genuine electrical picture to read from the plant — even if we continue to study and debate exactly what each pattern means at any given moment.
Why plants have changing electrical properties at all
Plants are not electrically inert. Plant physiology literature describes multiple kinds of electrical signals in plants — including action potentials and variation potentials — generated by ion channel activity (Ca²⁺, Cl⁻, K⁺ channels) and changes in membrane transport processes. These are fundamentally electrochemical phenomena, and they can propagate throughout the plant, linked with calcium waves and reactive oxygen species that contribute to systemic responses.
This is the physiological context that makes the measurement meaningful: there is real, time-varying electrical activity in plant tissues that responds to internal processes and environmental changes. The sensor doesn't invent a signal — it reads one that's already there.
From Wave to Pitch: The Data-to-Music Translation


The wave
Once you have a measurement that changes over time, you can plot it as a waveform — a standard way to visualize time-series data. PlantWave explicitly describes graphing the conductivity variation over time to produce a wave. This wave is not sound in the air, and it's not an audio recording from inside the plant. It's a graph of measured variation over time.
Once you have a time series, you can summarize or transform it in many ways: instantaneous value, short-window averages, derivatives, thresholds. These derived values are often what a sonification system maps into musical parameters. PlantWave also notes that traits of the wave beyond basic ups and downs — such as activity level or rate of change — can modulate musical behavior like tempo and effects.
The pitch mapping
The formal name for turning data relations into sound relations is sonification: the transformation of data relations into perceived relations in an acoustic signal, to support interpretation or communication. In practice, specific data features are mapped to specific sound parameters — in PlantWave's case, primarily pitch.
PlantWave analyzes the wave and matches it to the nearest frequency of a musical note, which becomes a digital message used to trigger instruments in the app. One detail that makes this concrete: the help center states that "the greater the distance between two adjacent notes, the greater change is happening within the plant." That describes a mapping where bigger signal changes produce larger pitch intervals — bigger jumps in note selection.
The mapping uses pentatonic scales — five-note scales that naturally avoid dissonance — so every combination of notes the plant "plays" will blend smoothly. This is a deliberate design choice that makes the output listenable regardless of how the signal moves.
Soundsets: The Final Layer

PlantWave uses the word soundset in a specific way: soundsets are collections of instruments designed for plants to play. Because the mapping pipeline ends by routing pitch messages to instruments, the same underlying plant-driven note stream can produce very different listening experiences depending on the instrument palette.
PlantWave describes soundsets as representing plant data "in a different way," and notes that each soundset has a different feel driven by instruments, note range, and tempo characteristics:
- A bell-like soundset makes changes feel percussive and bright
- A pad or ambient soundset smears changes into sustained textures
- A soundset with a narrow note range feels stable; a wide range feels more melodically varied
This matters because it means the experience of plant music is not fixed. Two people listening to the same plant through different soundsets are hearing the same underlying data rendered in entirely different sonic palettes — the biology is constant, the aesthetic is a choice.
PlantWave also notes that the music can vary with environmental factors like temperature, light, and hydration — framing the plant as continuously responding to its environment in ways that affect the measured signal and thus the mapped sound. What you hear is a real-time representation of variation in the measured signal, not a fixed composition or a loop.
What PlantWave Does Not Claim
A correct technical understanding also requires boundaries. PlantWave is explicit that it measures conductivity microfluctuations and translates the resulting wave into pitch messages that control instruments. That is a claim about measurement and mapping, not about recording audible sound from inside the plant. PlantWave also states it does not make claims about plant consciousness.
Putting those statements together, the cleanest "does not claim" list:
- Does not claim the plant is producing acoustic music on its own — the audible output is produced by digital instruments driven by the mapped signal
- Does not claim to be measuring thoughts, language, or intention — the measured quantity is conductivity between two electrode points
- Does not claim the music is a one-to-one readout of a single biological variable at laboratory precision — the system converts microfluctuations in conductivity (influenced by multiple factors) into a musical representation
These limits don't diminish what the system does — they define it accurately. The measurement is real. The translation is designed. Both are true at the same time, and neither requires overclaiming the other.
Key Takeaways
- The sensory input is microfluctuations in conductivity between two points on a plant, captured by two electrodes
- That signal is graphed over time into a wave, then translated into pitch messages (notes)
- Pitch messages drive digital instruments, grouped into selectable soundsets
- The mapping approach aligns with standard definitions of sonification as systematic transformation of data relations into perceived relations in sound
- The system explains measurement and mapping — and avoids claims about plant consciousness
Ready to Try It?
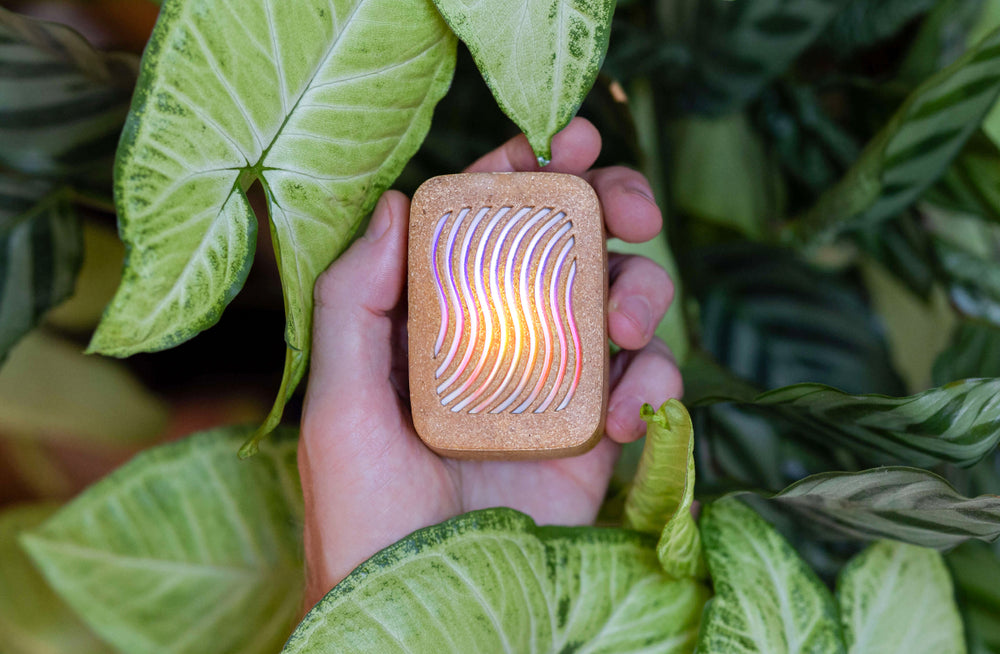
PlantWave connects to any plant in your home and translates its live electrical signals into real-time ambient music through your phone.
 Get PlantWave
Hear It on YouTube
Get PlantWave
Hear It on YouTube